What are the latest ad fraud trends and invalid traffic (IVT) rates in programmatic advertising? Pixalate examines the latest data to give you the most up-to-date insight on ad fraud trends in digital advertising.
Download the most recent Ad Fraud Trends report for the full scoop on the current state of IVT and ad fraud in programmatic digital advertising.
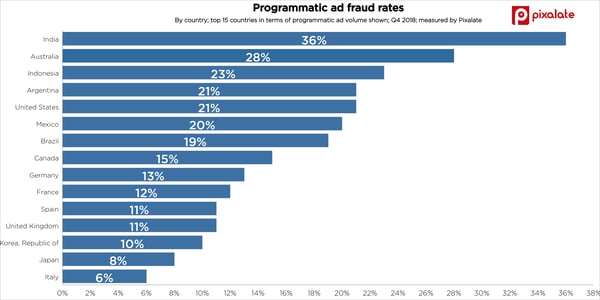
According to the latest ad fraud data, invalid traffic is on the rise even as advertisers become more aware of the tactics used by fraudsters.

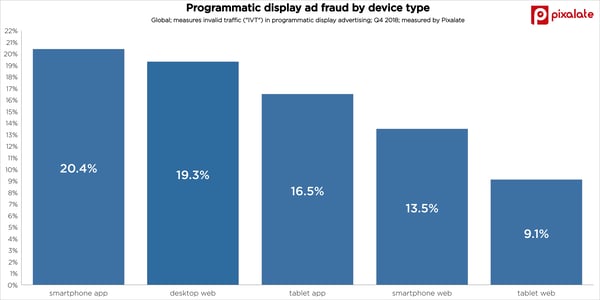
Smartphone in-app ad fraud has the highest invalid traffic rate, at over 20%. See the latest mobile ad fraud trends for more.

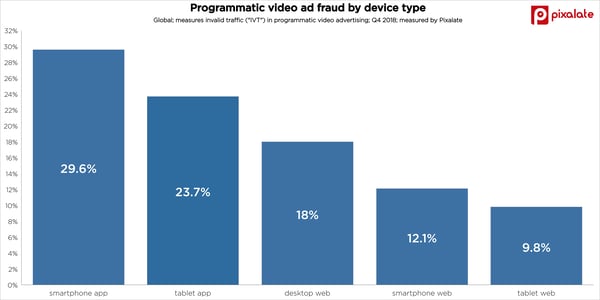
When it comes to programmatic video ad fraud trends, mobile in-app is the riskiest. See the mobile app fraud trends for details on the riskiest app categories.

Download the latest Ad Fraud Trends report for more information:
Still looking or more information about ad fraud?
For a high-level view of IVT in mobile advertising, view our mobile ad fraud trends.
For a more granular view of IVT in mobile advertising, view our mobile app fraud trends.
*By entering your email address and clicking Subscribe, you are agreeing to our Terms of Use and Privacy Policy.
These Stories on Research Reports
*By entering your email address and clicking Subscribe, you are agreeing to our Terms of Use and Privacy Policy.

Disclaimer: The content of this page reflects Pixalate’s opinions with respect to the factors that Pixalate believes can be useful to the digital media industry. Any proprietary data shared is grounded in Pixalate’s proprietary technology and analytics, which Pixalate is continuously evaluating and updating. Any references to outside sources should not be construed as endorsements. Pixalate’s opinions are just that - opinion, not facts or guarantees.
Per the MRC, “'Fraud' is not intended to represent fraud as defined in various laws, statutes and ordinances or as conventionally used in U.S. Court or other legal proceedings, but rather a custom definition strictly for advertising measurement purposes. Also per the MRC, “‘Invalid Traffic’ is defined generally as traffic that does not meet certain ad serving quality or completeness criteria, or otherwise does not represent legitimate ad traffic that should be included in measurement counts. Among the reasons why ad traffic may be deemed invalid is it is a result of non-human traffic (spiders, bots, etc.), or activity designed to produce fraudulent traffic.”

