The iPhone X was officially released on November 3, 2017. Nearly three months later, about 5% of iPhone users are on Apple’s highest-end smartphone, according to recent research from Pixalate.
This research comes as new reports surface indicating that Apple may nix the iPhone X in 2018. (A report which is up for debate.)
The iPhone X: Fast-growing, but fast enough?
When looking at just the iOS ecosystem, iPhone X has seen steady growth in its first three months of existence. According to Pixalate's research, the device went from having no iOS device market share when it launched (obviously) to about 5% of the U.S. iOS market share within three months.
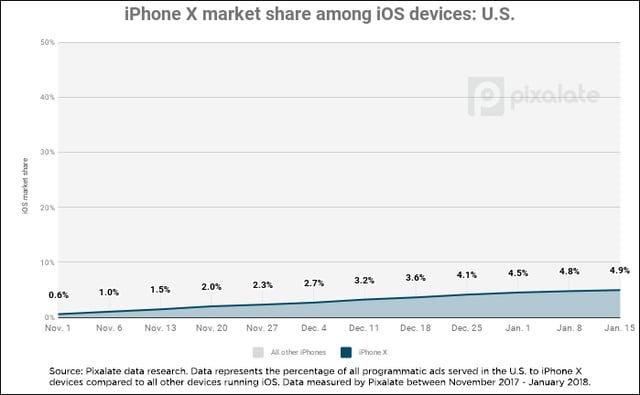
About 1-in-20 Apple smartphone users are sporting the iPhone X today, per Pixalate's research. That figure has seen steady week-over-week growth since launch, although the growth did taper off in mid-January after the holiday rush.
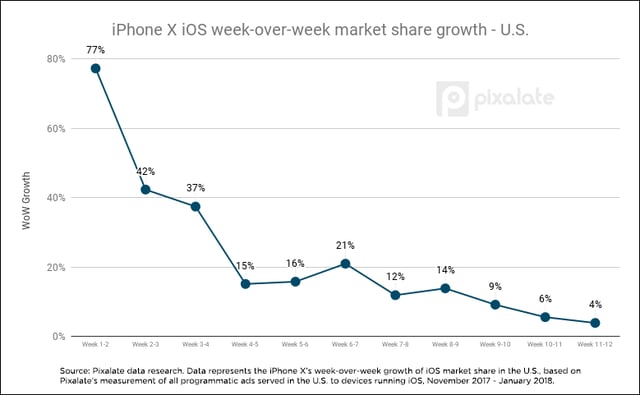
Here is a chart depicting the iPhone X iOS market share growth week-over-week since launch (in the U.S.).
What is the above chart showing?
This chart depicts the week-over-week market share growth of the iPhone X within the United States among all iOS devices.
Example: Pretend there are 100 total iPhones in the U.S. during Week 1, and two of them are iPhone Xs. And then in Week 2, three of them are iPhone Xs. In this example, the iPhone X saw its market share increase 50% week-over-week (from 2% to 3%).
- According to Pixalate's data, the iPhone X saw its United States iOS market share increase 77% in its second week of existence, compared to its first week.
- The iPhone X’s market share increased about 40% each week between weeks 2-3 and 3-4.
- After its first month, week-over-week market share growth declined to the mid-teens.
- After two months, week-over-week market share growth dipped to the single digits.
- After three months, week-over-week market share growth slowed to the low single digits.
What are the takeaways?
It’s no surprise to see the largest market share growth figures happen when the device first launched. Since it’s growing from nothing, the percentages are bound to be larger at the beginning.
But the fact that the iPhone X has fallen to the low single digits in terms of market share growth week-over-week indicates that the device might not rise too much higher in terms of overall market share (which currently sits just below 5%).
iOS market share by device
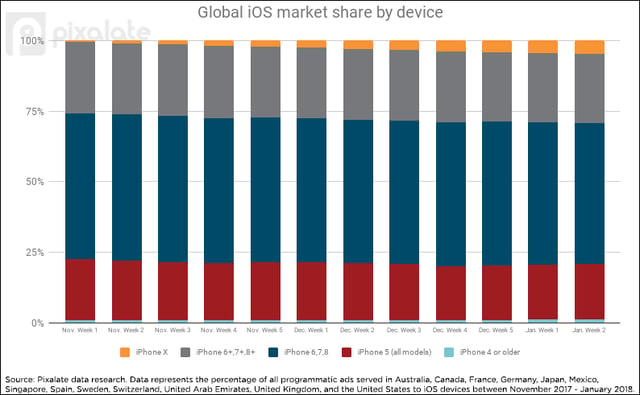
Above is a chart depicting the iPhone X’s week-over-week global* market share (*based on the 13 countries studied — see methodology below) compared to all other iPhone models.
According to Pixalate's latest data, the iPhone X accounted for about 4.6% of the global iOS market share — slightly under the U.S. figure of 5%.
- Per Pixalate's data, the iPhone X has seen its market share rise to about 4.6% over its first three months.
- iPhone 6+, 7+, and 8+ models accounted for about 25% of the global market share each week.
- There was a slight downward trajectory among this grouping, slowly dipping from about 25.2% at the beginning of November to 24.8% in the middle of January.
- iPhone 6, 7, and 8 models saw their collective market share slightly decrease over this three month period.
- These models made up about 51.9% of the iOS market share in early November, slowly falling to 49.8% in mid-January.
- iPhone 5 models decreased from about 21.5% to 19.9% in this span.
- iPhone 4 models hovered around 1% for the entire span.
Key takeaway: iPhone X growth is primarily coming at the expense of all iPhone 5 models and the combination of iPhone 6, 7, and 8 models, according to Pixalate's data.
iPhone X seeing stronger adoption in Singapore; Canadian adoption is trailing
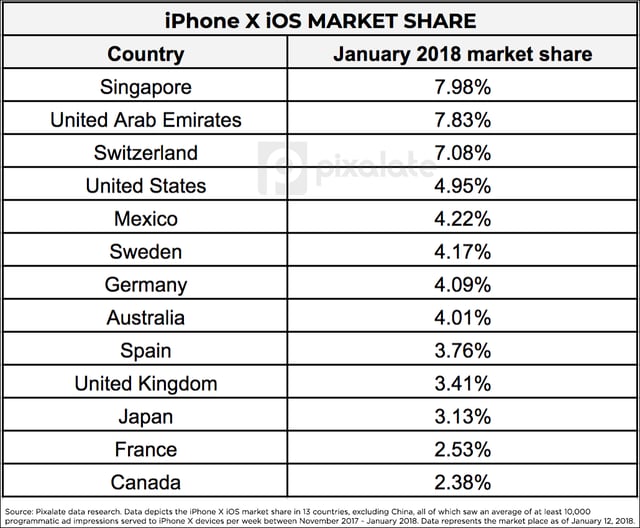
Pixalate’s data reveals that, of the countries studied, the iPhone X is most popular in Singapore and the United Arab Emirates, at just under 8% of the iOS market share in those countries.
- Switzerland is third, where the iPhone X accounts for 7.08% iOS market share.
- The U.S. was fourth, at just under 5%
- Mexico, Sweden, Germany, Australia, and Spain are all in the 4% range, while the U.K. is at 3.5%
- Among the countries studied, France (2.53%) and Canada (2.38%) were the slowest markets to adopt the iPhone X, according to Pixalate’s data.
Methodology
Pixalate examined smartphone data from 13 countries to conduct this research, including Australia, Canada, France, Germany, Japan, Mexico, Singapore, Spain, Sweden, Switzerland, United Arab Emirates, United Kingdom, and the United States. China was not included.
The data contained in this blog post represents ad impressions served to each specific device, inclusive of mobile web impressions and in-app impressions, unless otherwise stated, as identified by Pixalate’s measurement script. Pixalate measured over 10 billion total ad impressions for this study, including over 4 billion iPhone ad impressions and over 100 million iPhone X ad impressions.
The data was collected from November 3, 2017, through January 12, 2018.
Want more data-driven insights? Sign up for our blog!


