New data from Pixalate shows that over 85% of programmatic TV advertising impressions occur in the United States.
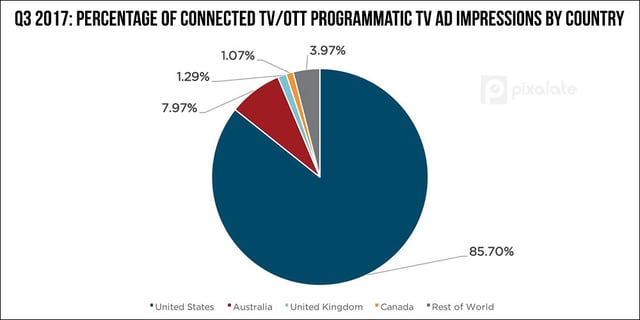
Pixalate measured worldwide Connected TV/OTT programmatic ad impressions throughout 2017 for this study. The United States easily leads the way, with 85.7% of all Q3 2017 programmatic TV ad impressions being served in that region.

In Q3 2017, the top 10 countries in terms of programmatic TV market share were:
In terms of volume (the raw number of programmatic TV advertising impressions served within each country), the United States saw a 6x growth in programmatic TV volume.
Notable countries that saw a large increase in programmatic TV volume in 2017:
Notable countries that saw a decrease in programmatic TV volume in 2017:
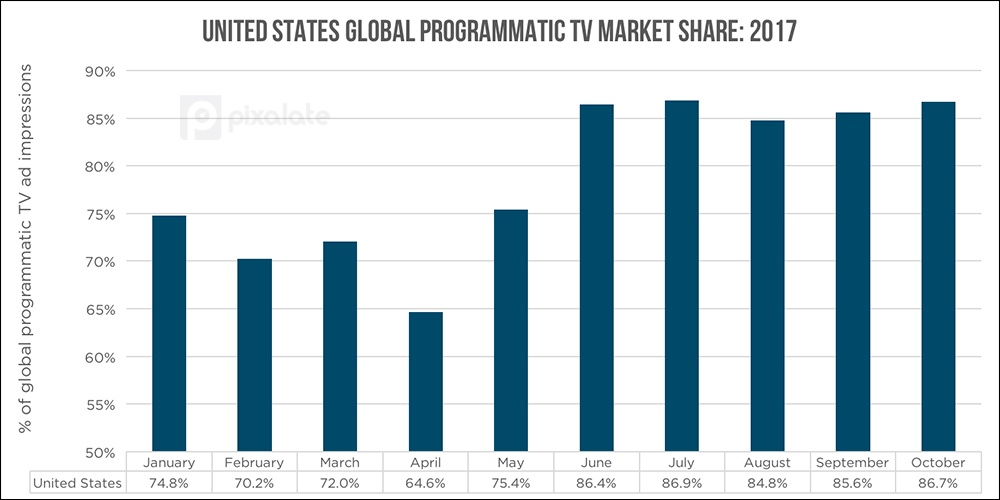
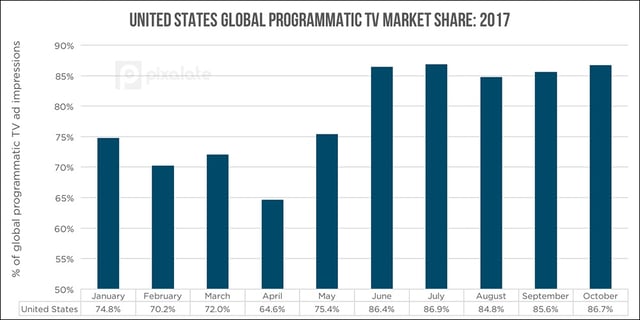
The United States has seen its share of the programmatic TV ad marketplace grow from roughly 70-75% in Q1 to over 85% in Q3. Here is a chart showing the month-over-month change in the United States’ market share:

Takeaways:

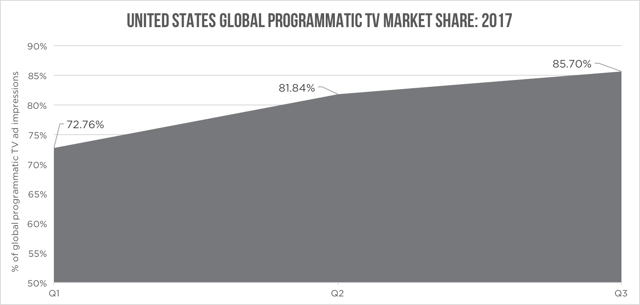
The U.S. saw a 12.94% change in term of its Q1 2017 market share (72.76%) to its Q3 2017 market share (85.70%). No other country saw as big of a change.
In fact, Australia (up 5.92% in Q3 vs. Q1) was the only other country to grow at a rate higher than 1%.
New Zealand (up 0.28%), Saudi Arabia (up 0.16%), and Russia (up 0.03%) round out the top five.
On the flip side, Canada saw its share of the programmatic TV ad impression marketplace drop from 7.19% in Q1 to 1.07% in Q3, for a drop of 6.12%. This was the largest dip of any country in the world. While Canada’s raw programmatic TV volume did increase by 40% throughout the year, it didn’t rise nearly as fast as some of the other leading countries, and thus saw its market share decrease.
Another notable country to lose market share was the United Kingdom, which saw its share fall 3.43% (down from 4.72% to 1.29%). As noted above, the U.K. also saw a decrease in raw programmatic TV volume, so a dip in market share was to be expected.
Spain (down 2.87%), Vietnam (down 1.33%) and Japan (1.04%) were the other countries that lost at least 1% market share from Q1 to Q3.
Want more data-driven insights? Sign up for our blog!
*By entering your email address and clicking Subscribe, you are agreeing to our Terms of Use and Privacy Policy.
These Stories on Thought Leadership
*By entering your email address and clicking Subscribe, you are agreeing to our Terms of Use and Privacy Policy.

Disclaimer: The content of this page reflects Pixalate’s opinions with respect to the factors that Pixalate believes can be useful to the digital media industry. Any proprietary data shared is grounded in Pixalate’s proprietary technology and analytics, which Pixalate is continuously evaluating and updating. Any references to outside sources should not be construed as endorsements. Pixalate’s opinions are just that - opinion, not facts or guarantees.
Per the MRC, “'Fraud' is not intended to represent fraud as defined in various laws, statutes and ordinances or as conventionally used in U.S. Court or other legal proceedings, but rather a custom definition strictly for advertising measurement purposes. Also per the MRC, “‘Invalid Traffic’ is defined generally as traffic that does not meet certain ad serving quality or completeness criteria, or otherwise does not represent legitimate ad traffic that should be included in measurement counts. Among the reasons why ad traffic may be deemed invalid is it is a result of non-human traffic (spiders, bots, etc.), or activity designed to produce fraudulent traffic.”

